Composing Figures
Pylustrator can also be used to compose panels of different subplots using the function the function pylustrator.load().
Example
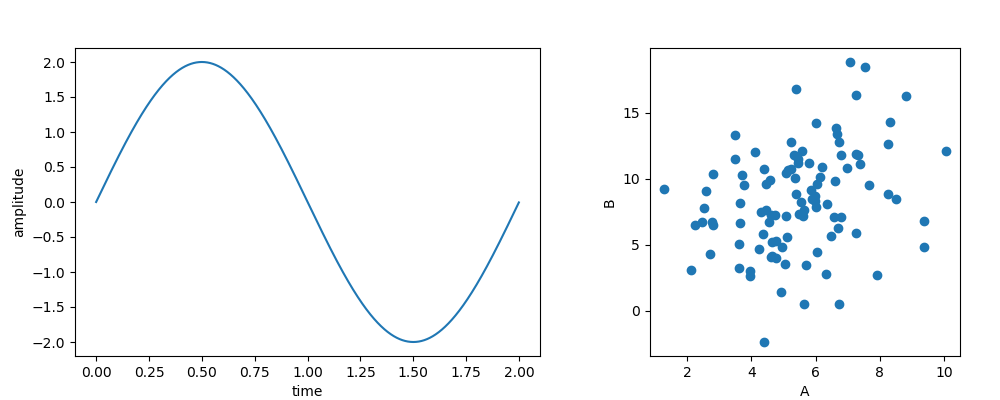
Suppose we have two plot files that we want to include in our figure:
 1import matplotlib.pyplot as plt
 2import numpy as np
 3
 4t = np.arange(0.0, 2, 0.001)
 5y = 2 * np.sin(np.pi * t)
 6
 7plt.figure(0, (6, 4))
 8plt.plot(t, y)
 9plt.xlabel("time")
10plt.ylabel("amplitude")
11plt.savefig("plot1.png")
12
13plt.show()
 1import matplotlib.pyplot as plt
 2import numpy as np
 3
 4np.random.seed(1)
 5a, b = np.random.normal(loc=(5., 3.),
 6                        scale=(2., 4.),
 7                        size=(100, 2)).T
 8b += a
 9
10plt.figure(0, (4, 4))
11plt.plot(a, b, "o")
12plt.xlabel("A")
13plt.ylabel("B")
14plt.savefig("plot2.png")
15plt.show()
Now we can create a script that generates the composite figure:
1import matplotlib.pyplot as plt
2import pylustrator
3
4pylustrator.load("plot1.py")
5pylustrator.load("plot2.py", offset=[1, 0])
6
7plt.show()
The subfigures can both contain also multiple axes (e.g. subplots) or be previously styled with pylustrator. The composite figure can also be styled with pylustrator to finialize the figure.
Note
Please note that the code of the target script will be executed, to only load script files from trusted sources. This also holds true when loading scripts from a cached pickle representation, see Caching.
Supported Formats
With pylustrator.load() different types of inputs can be used to add to a composite figure.
Python Files
If the input is a “.py” file then the file is compiled and executed. All the figure elements that are generated from the python file are then inserted into the target figure.
Note
All your plotting code should be in the main part of the script, everything hidden behind a if __name__ == “__main__”: will be ignored.
Image Files
If the input is any image format that can be opened with plt.imread() then the file is loaded and its content is displayed in a separate axis using plt.imshow(). To scale the image, pylustrator uses the dpi settings of the figure. You can also provide the dpi keyword to pylustrator.load() to scale the image.
Svg Files
If the input file is a svg file, then pylustrator tries to generate matplotlib patches to display the content of the svg file in a new axes.
Warning
The svg specification is broader than the patches supported by matplotlib. Therefore, gradients, filters, fill patterns and masks cannot be supported. Also svg offers some advances positioning features for text (e.g. letter-spacing, word-spacing) which are difficult to match in matplotlib. There might be some more differences in details in the implementations. If you thing something can be addressed in matplotlib, you can report it in the bugtracker.
Positioning
Loaded subfigures can be positioned using the offset keyword. Offsets can have different units.
The default unit is to interpret it as a percentage of the current figure size. Note, that when calling multiple imports, the figure size changes between calls. Therefore, a 2x2 grid can be achieved with relative offsets as follows:
1pylustrator.load("plot1.py")
2pylustrator.load("plot2.png", offset=[1, 0])
3pylustrator.load("plot3.jpg", offset=[0, 1])
4pylustrator.load("plot4.svg", offset=[0.5, 0.5])
The offset can also be specified in cm or in in. Therefore, the third entry of the tuple can be the string “cm” or “in”. For example:
1pylustrator.load("plot1.py")
2pylustrator.load("plot2.png", offset=[2, 1, "cm"])
3pylustrator.load("plot3.jpg", offset=[0.3, 0.9, "in"])
Caching
Pylustrator also offers the possibility to cache the figures generated by a script file. Therefore, the figure is pickled after it has been created from the script and saved next to the script. If the script is newer (last modified timestamp) as the pickle file with the cached figure, the script is executed again. The caching behavior can be disabled with the keyword cache=False.